The heat map function is used with people counting to determine the overall crowd flow (density) or idle time of an object in the detection area over a certain amount of time. A heat map report can be viewed in the Report tab of the interface. For more information on how to set up a people counting rule, click here.
Step 1: Access your camera in a web browser, for more information on how to access the web UI for your device click here.
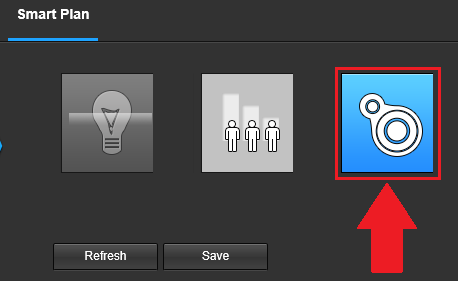
Step 2: Navigate to Setup>>Event>>Smart Plan and enable the Heat Map smart plan. Click Save.
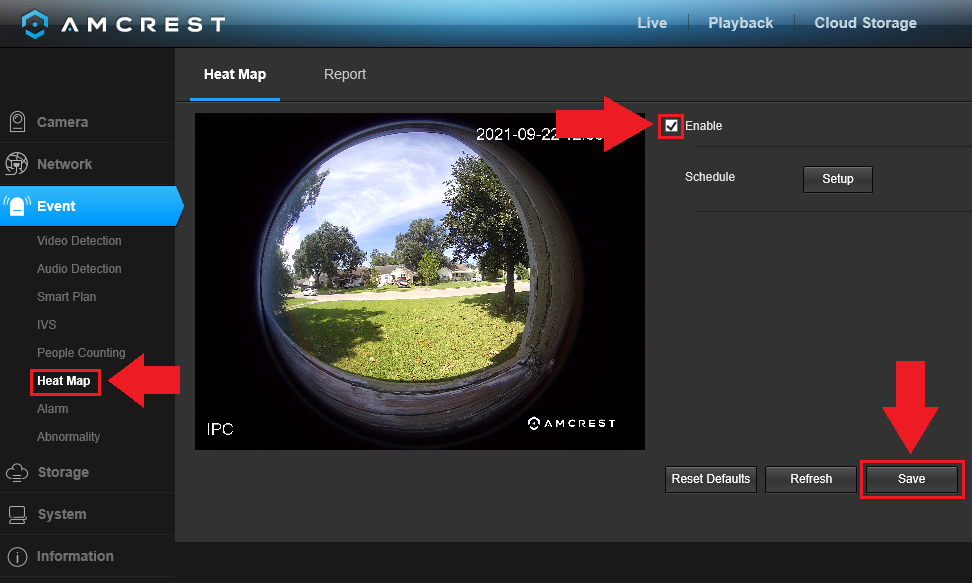
Step 3: In the Event tab click on Heat Map and click on the Enable option. Click Save.
Using the Report Tab
Use the reports tab to view a report of the heat map. To view a heat map report, please refer to the information provided below.
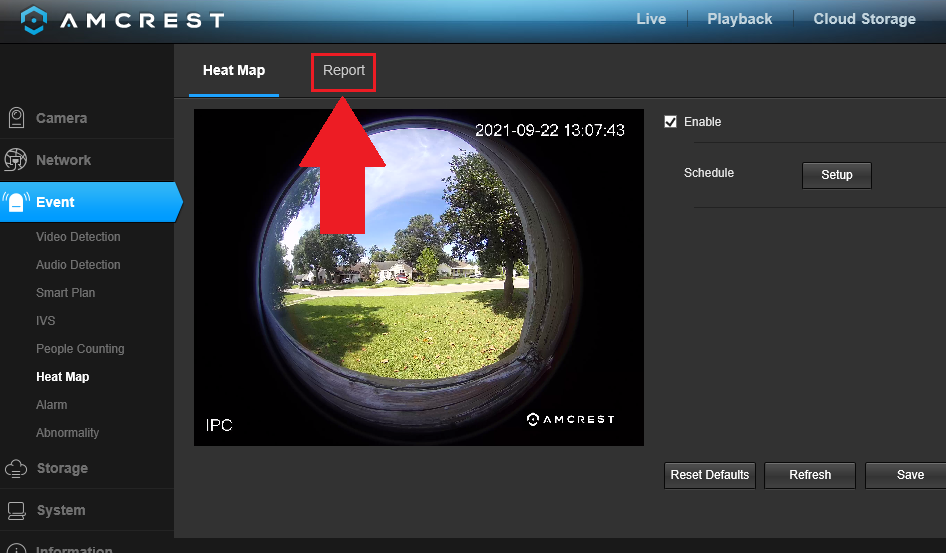
Step 1: In the Heat Map menu, click on the Report tab.
Step 2: Enter the start and end times of the report. Use the calendar option to view other days of the week, please note it can report a max of 1 week.
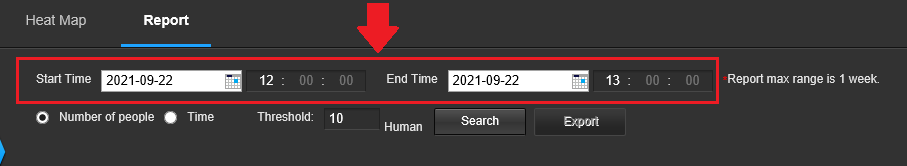
Step 3: Choose a report type, if you would like the density of people based on the number of people detected choose Number of People, if you would like to view the density based on a threshold of time, select Time.
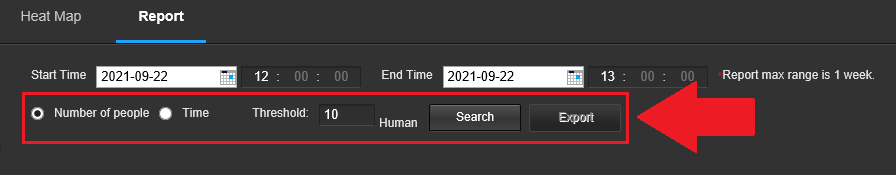
Step 4: If you are using "Number of People", enter the threshold into the Human field (should be the Inside Number set in the people counting option) and click Search. If you are using Time, enter the number of minutes into the Minutes field and click Search. The report will be displayed in the interface. The density will be color-coded, blue being the minimum and red being the maximum.
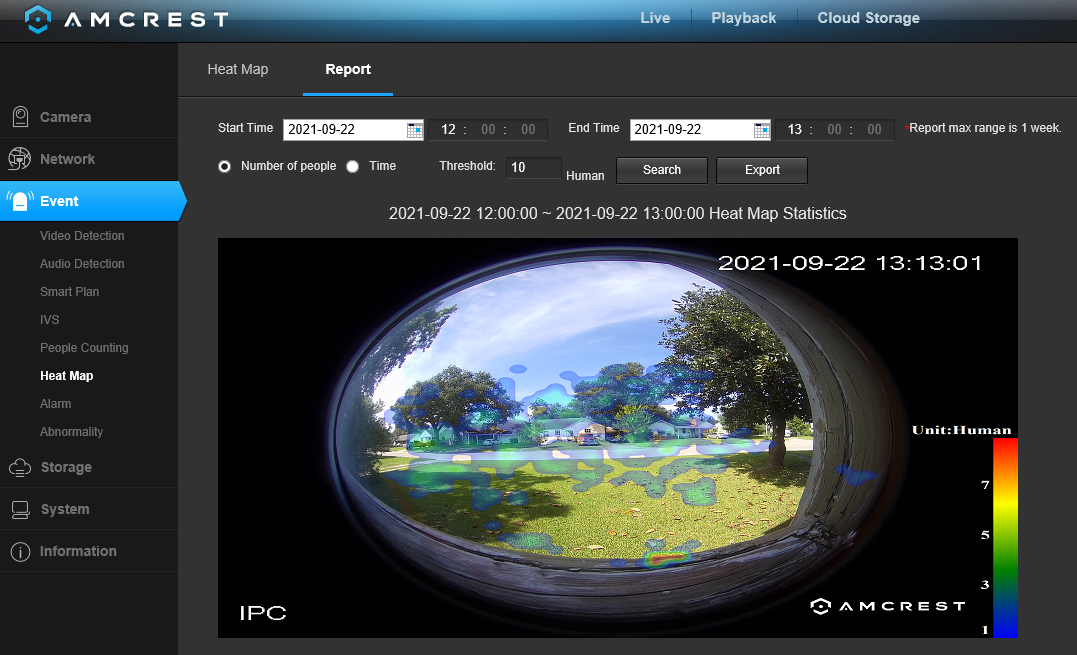
Note: If you would like to export the image, click Export, select a path and download.
Comments
Please sign in to leave a comment.